This year it might seem like things are hard to keep track of. So much has changed, and yet at the same time so little has happened, that from desk level it can be hard to put your finger on hard facts on which to base marketing decisions and inform key messaging.
Fortunately, Google provides a tool which can really help you to see the wood for the trees! Google Trends gives you a top-level overview of how frequently people have looked for specific terms, which is a great way to see how people’s behaviours have changed over time, what they want to know about and conversely what they no longer care for.
How does Google Trends work?
Google Trends uses Google’s own data on what people are searching for, when, where and in what quantities to provide an indication of how popular a search term has been over a given period. It’s important to note that it won’t tell you how many times something has been searched for, but it will instead create a graph which shows relative popularity over time ranging from 100 (the point at which interest was at its highest) to 0 (lowest level of popularity).
You can play around with the data to a certain extent, such as by adjusting the geography, time scale and type of search that you’d like to take into account. Probably the best functionality though is the ability to add in multiple comparative terms, enabling you to see how different search terms have varied in popularity over time.
How can I use Google Trends in my marketing?
There’s a couple of key ways this platform can be used to inform your marketing work, which we’ve outlined below.
- Creating a news story or content: Google Trends data can provide the proof you need that something has grown in popularity and is therefore worthy of the media’s time and attention. This could be a particular product/service/brand that is directly related to your business, or it could be something quirkier and more left field that allows you to create a nice story that’s not overtly related to your products and therefore not so salesy. People know about Google and they recognise that significant increases in searches indicates a significant change in interest in the market. Google Trends will even help you to bolster your case by telling you how well related topics and queries have done. You can then use this data to support press releases, blogs or articles, or even do something a bit more creative with it such as creating infographics or interactively mapping the data.
- Timing: If you’ve got a good story but aren’t sure when to send it out, have a look to see if there are any times throughout the year when interest in the topic is especially high. You can look for a term over five years, which should give you a good idea of regular seasonal highs and lows, or you can set a customised time range if you’d like to look at results over a longer or shorter time period.
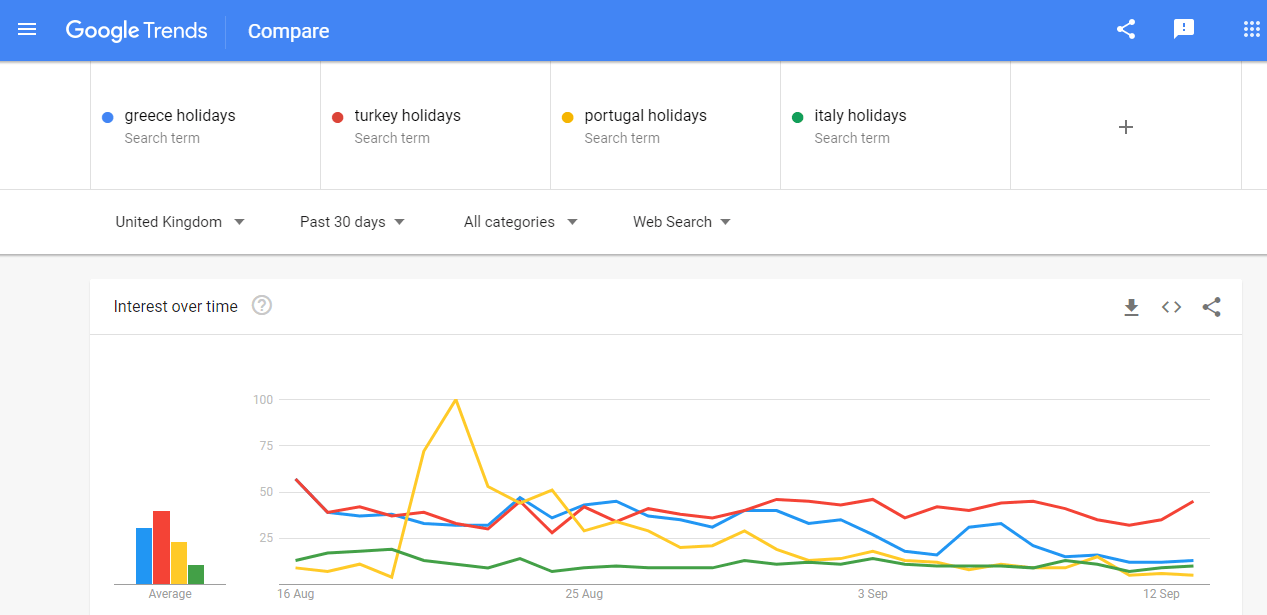
Image: Google Trends data of popular holiday searches over the past 30 days.
- SEO research: Knowing what terms relevant to your business are the most searched for can really help you nail down the keywords you want to use as part of your SEO strategy. For example, if there are multiple similar terms and you’re not sure which one should be prioritised, a quick comparative search will show you which one is being searched for the most and should therefore be the frontrunner in your keyword list.
- Audience insights: By making a list of searches that are important to your business and regularly running them through Google Trends you’ll be able to get valuable insights into your audience and what they want to know about. The suggested topics and queries list is particularly useful here, as it might flag up searches you never would have considered but which it turns out your audience are looking for in relation to terms connected to you.
Getting into Google
If you’ve never used Google Trends before then right now is a great time to get started. Not only can it help you to focus your marketing in the above ways, but with all the upheaval, changes and general weirdness of 2020 there’s bound to be an interesting story or useful insight that can be gleaned.
You’ll probably notice after not too much looking that stats tend to go a bit crazy around the March/April period when the lockdown kicked in. Some of the increase might just be because so many people were inside and on their computers (so there were more searches going on in general) but it’s still really interesting to see what went up, what went down and how some comparative terms flipped in popularity.
We hope this blog post has been useful and that it’s inspired you to check out Google Trends. If you come across any results that have surprised you or which have proven particularly insightful drop us a message on Twitter or LinkedIn, as we’d love to hear about it!